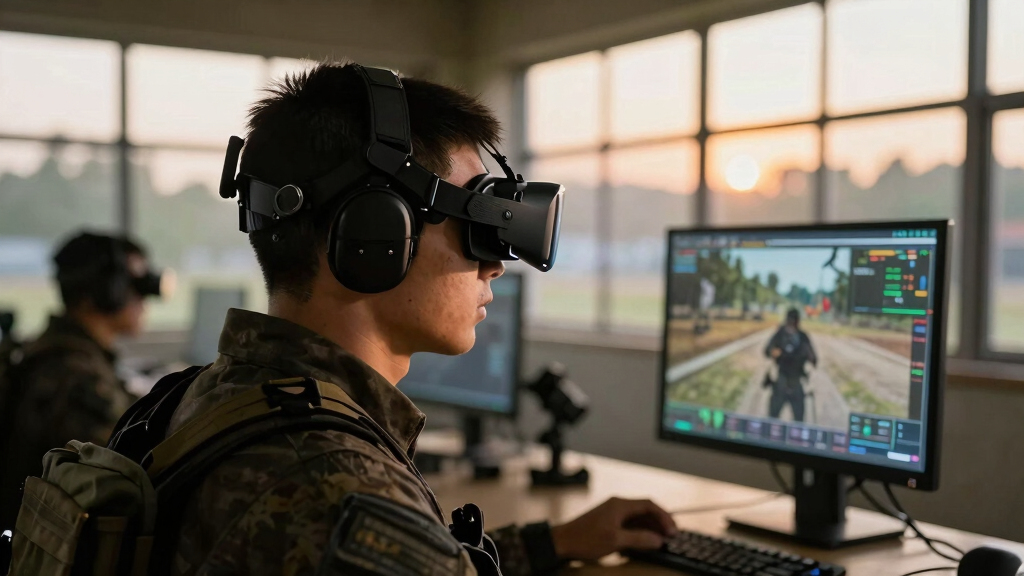

📊 Full opportunity report: Inside AI's Impact On Live Combat Visualization Technologies on ThorstenMeyerAI.com — validation score, market gap, and execution plan.

Get business pricing on office and shipping supplies
- Business-only prices and quantity discounts
- Tax-exempt purchasing
- Multiple users, one account, clear invoices
TL;DR
AI technology is now enabling real-time, cinematic visualizations of live trading data, as demonstrated by Bitcoin War. This development offers immersive market insights without trading functions, highlighting AI’s creative potential in finance visualization.
AI-driven visualization tools are now capable of transforming live market data into immersive, cinematic experiences, exemplified by the recent launch of Bitcoin War at war.isbitcoindead.com. This project uses advanced browser technology to depict real-time Bitcoin trading activity as a dynamic battlefield, offering viewers a visceral view of market dynamics without any trading or financial advice. The development highlights how AI and web tech are converging to create new forms of data representation that are both artistic and informative.
Bitcoin War is a browser-based visualization that connects directly to the Binance and Coinbase public trade streams via WebSocket, ensuring continuous data flow. The system visualizes each trade as a combatant—buy orders push the front from the left, sell orders from the right, with large liquidations represented as airstrikes—creating a visceral war scene. The entire setup is built with minimal footprint, utilizing Canvas 2D graphics, WebAudio synthesis, and real-time stream processing entirely client-side, with no backend infrastructure. An automatic camera shifts perspectives, and a live DEFCON meter indicates market volatility, while a scrolling log narrates ongoing conflict. The project is explicitly non-transactional, emphasizing its artistic and data-driven nature, with the footer stating, ‘a live reading of the BTC/USDT tape · no advice, only war.’
Implications of AI-Enhanced Market Visualizations
This development demonstrates how AI and web technologies can be harnessed for creative data visualization, providing immersive experiences that deepen understanding of market activity. It highlights a shift toward artistic representations of financial data, which could influence how traders, analysts, and the public perceive market volatility and dynamics. While not a trading tool, such visualizations can foster greater engagement and awareness of market chaos, especially in highly volatile environments like cryptocurrency trading.
real-time data visualization software
As an affiliate, we earn on qualifying purchases.
As an affiliate, we earn on qualifying purchases.
Evolution of Web-Based Data Visualization in Finance
Traditional market data displays rely on charts and numerical readouts, offering limited engagement. Recent innovations, including Bitcoin War, leverage browser technologies such as Canvas and WebAudio to create real-time, cinematic representations of market activity. This approach aligns with a broader trend of using immersive, artistic visualizations to interpret complex data streams, with prior projects demonstrating the potential of web tech for real-time data storytelling. Bitcoin War builds on these advances by providing a visceral, war-themed narrative of market chaos, emphasizing the power of client-side processing and minimal infrastructure.
“This project exemplifies how advanced web technologies can be used to create immersive, artistic visualizations of real-time data, pushing the boundaries of traditional market displays.”
— an anonymous researcher
Unclear Aspects of AI-Driven Market Visualizations
It remains unclear how widely such visualizations will be adopted outside artistic or niche contexts, and whether they can influence market behavior or trader decision-making. The long-term impact of immersive visualizations on market transparency or manipulation is also uncertain. Additionally, the extent to which AI enhances these visualizations beyond aesthetic appeal has not been explicitly demonstrated, and technical limitations or scalability issues could emerge as the technology advances.
Future Developments in AI and Web-Based Market Visuals
Next steps include exploring how such visualizations can be integrated into broader market analysis tools or used for educational purposes. Developers may enhance AI capabilities to generate more detailed or predictive visual narratives. Monitoring user engagement and potential influence on market perception will be key, alongside technical improvements to expand accessibility and realism. Further projects may also seek to combine artistic visualization with actual trading insights or decision support systems.
Key Questions
Is Bitcoin War a trading tool?
No, Bitcoin War is purely a visualization project. It does not involve trading, wallets, or financial advice, and its purpose is artistic and informational only.
How does Bitcoin War generate its visualizations?
The system connects to real-time trade streams via WebSocket, visualizing trades as combatants in a battlefield, with graphics created entirely using browser technology like Canvas 2D and WebAudio.
Can these visualizations influence trading decisions?
Currently, there is no evidence that such visualizations impact trading strategies. They serve as artistic representations and are not designed for decision-making or advice.
Are these visualizations accessible to everyone?
Yes, they are available for free and run instantly in any modern web browser, making them widely accessible without special software.
What are the limitations of these visualization tools?
Limitations include potential scalability issues, limited influence on actual market behavior, and the current focus on artistic rather than analytical or predictive functions.
Source: ThorstenMeyerAI.com
Fall Picks
fall essentials
As an affiliate, we earn on qualifying purchases.